As a cinematographer I have always tried to have as much control as possible of the image I create. This simple article that reaches your hands is the result of that attempt after years of reading and learning to handle myself in digital environments, something that I honestly don’t know if I achieved it. So let my concerns about Zone Systems be shared in this text.
The zone system of analog photography in digital cinematography
By Alfonso Parra AEC, ADFC
I often hear the zonal system, devised by Ansel Adams and Fred Archer, being related to the digital image and in this article, I intend to reflect on the extent to which this relationship is valid and transferable from one system to another, specifically in the world of cinema. To begin, let us remember that the zone system not only covers the measurement and exposure of the scene, but is a complete process that includes the study of negative and positive material as well as the chemical development of each of them.
The system compares the luminance of the scene with the luminance values of the positive copy, passing through the density of the negative once exposed. The objective of the zone system, in short, is to be able to predict the results in the positive copy of the image that emerged from the negative after its exposure, relating the contrasts of the scene with the final contrast in the copy. The zone system can be defined in three simple ways(1):
1 – Values of the positive copy. Each zone (numbered from 0 to IX) symbolizes a different tone of luminosity in the positive that goes from black, passing through gray and ending in white (all this referring to black and white copies). So, for example, zone 0 represents black, zone V represents 18% middle gray, and zone IX represents 90% white values. These zones are related to the luminance of the measured zones in the scene (Figure 1).
2 – Each zone reveals not only different luminance values but also the amount of detail and texture that we can see. In this way we associate to each zone objects that usually appear frequently in them. For example, dark hair is in zone III or snow is in zone VIII.

Figure 1
3 – The zones can be easily measured using a spot meter and expressed in cd/m2 ratios, EV numbers or calculated in F stop. When both the negative and the positive are revealed in a “normal” way and adjusted to their respective latitude, each zone corresponds to an exposure stop step.
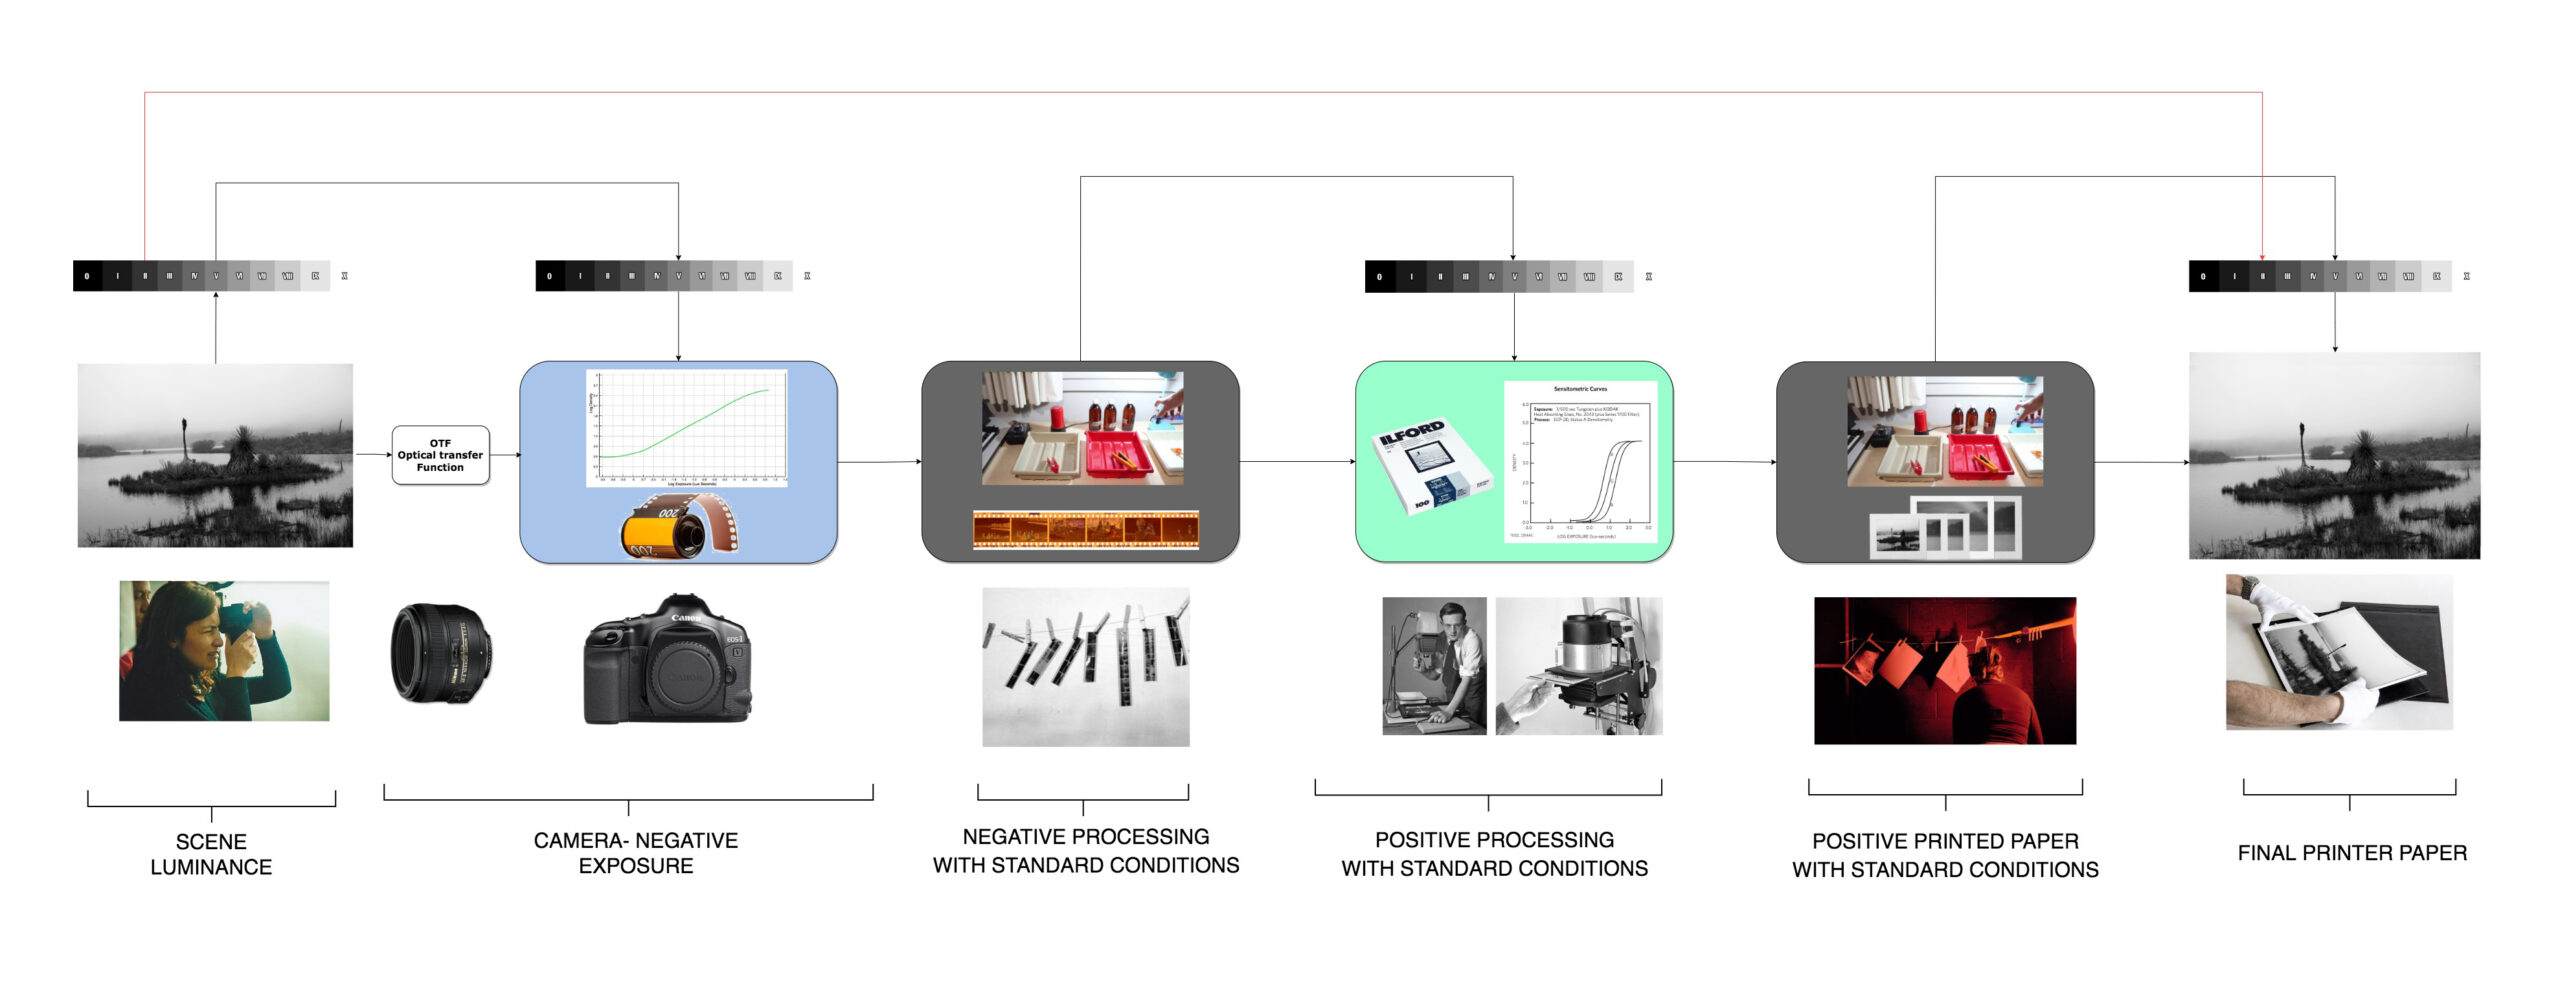
Figure 2
According to the scheme (figure 2), the luminance values of different areas of the image are, through exposure, captured in the negative in the form of densities, densities that depend not only on the intensity of the light that reaches the negative but also of the gamma with which the emulsion is built and of the development process. During the printing process, these densities are projected onto the positive support; the image obtained will depend on the exposure time, the positive, its gamma and its development process. Finally, we can establish a relationship if the whole process is standardized between the luminance values of the scene and that of the photographic positive. The system itself allows you to get an idea of what the final result will look like on the print when the picture is taken, considering the different measurements of the reflected light in the different areas of the scene.
Of course, this entire system is subject to a standardization process, since any change in the emulsion, development processes (chemicals, times and temperatures) or in the positive support itself (different manufacturers, different contrasts, etc.) entails a change in the distribution of areas. In the cinematographic world, the process is very standardized, with fewer emulsions than the world of photography and with more generalized developing and printing conditions, in addition to just a few positives to choose from.
If we want or need to replicate this system in the digital world (figure 3), we would have to relate the contrast ratio of the scene in relation to the gamma curve used in the camera, the cv (in RGB decimal values) of the image, as well as the brightness value (nit) on the monitor or projection screen of those cv. The brightness values of the scene that we measure with our spotmeter correspond to a certain brightness value emitted by the monitor when the different functions have been applied to these values (gamma, Knee, matrix, iso, etc.), also considering that these scene brightness values are in relation to the cv (code value), read in the wfm (in video signal mode), histogram or false color. If we could establish this relationship, measuring a certain point of the scene we would know what luminance value that point will have on the monitor and therefore what detail and texture. Seen in a very simple way, it would be something like the following scheme:
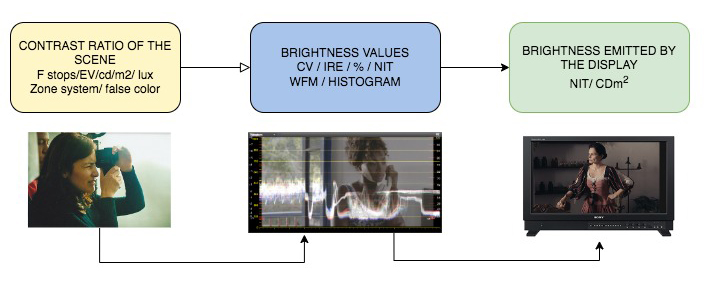
Figure 3
But things are somewhat more complicated, let’s see in this graph:
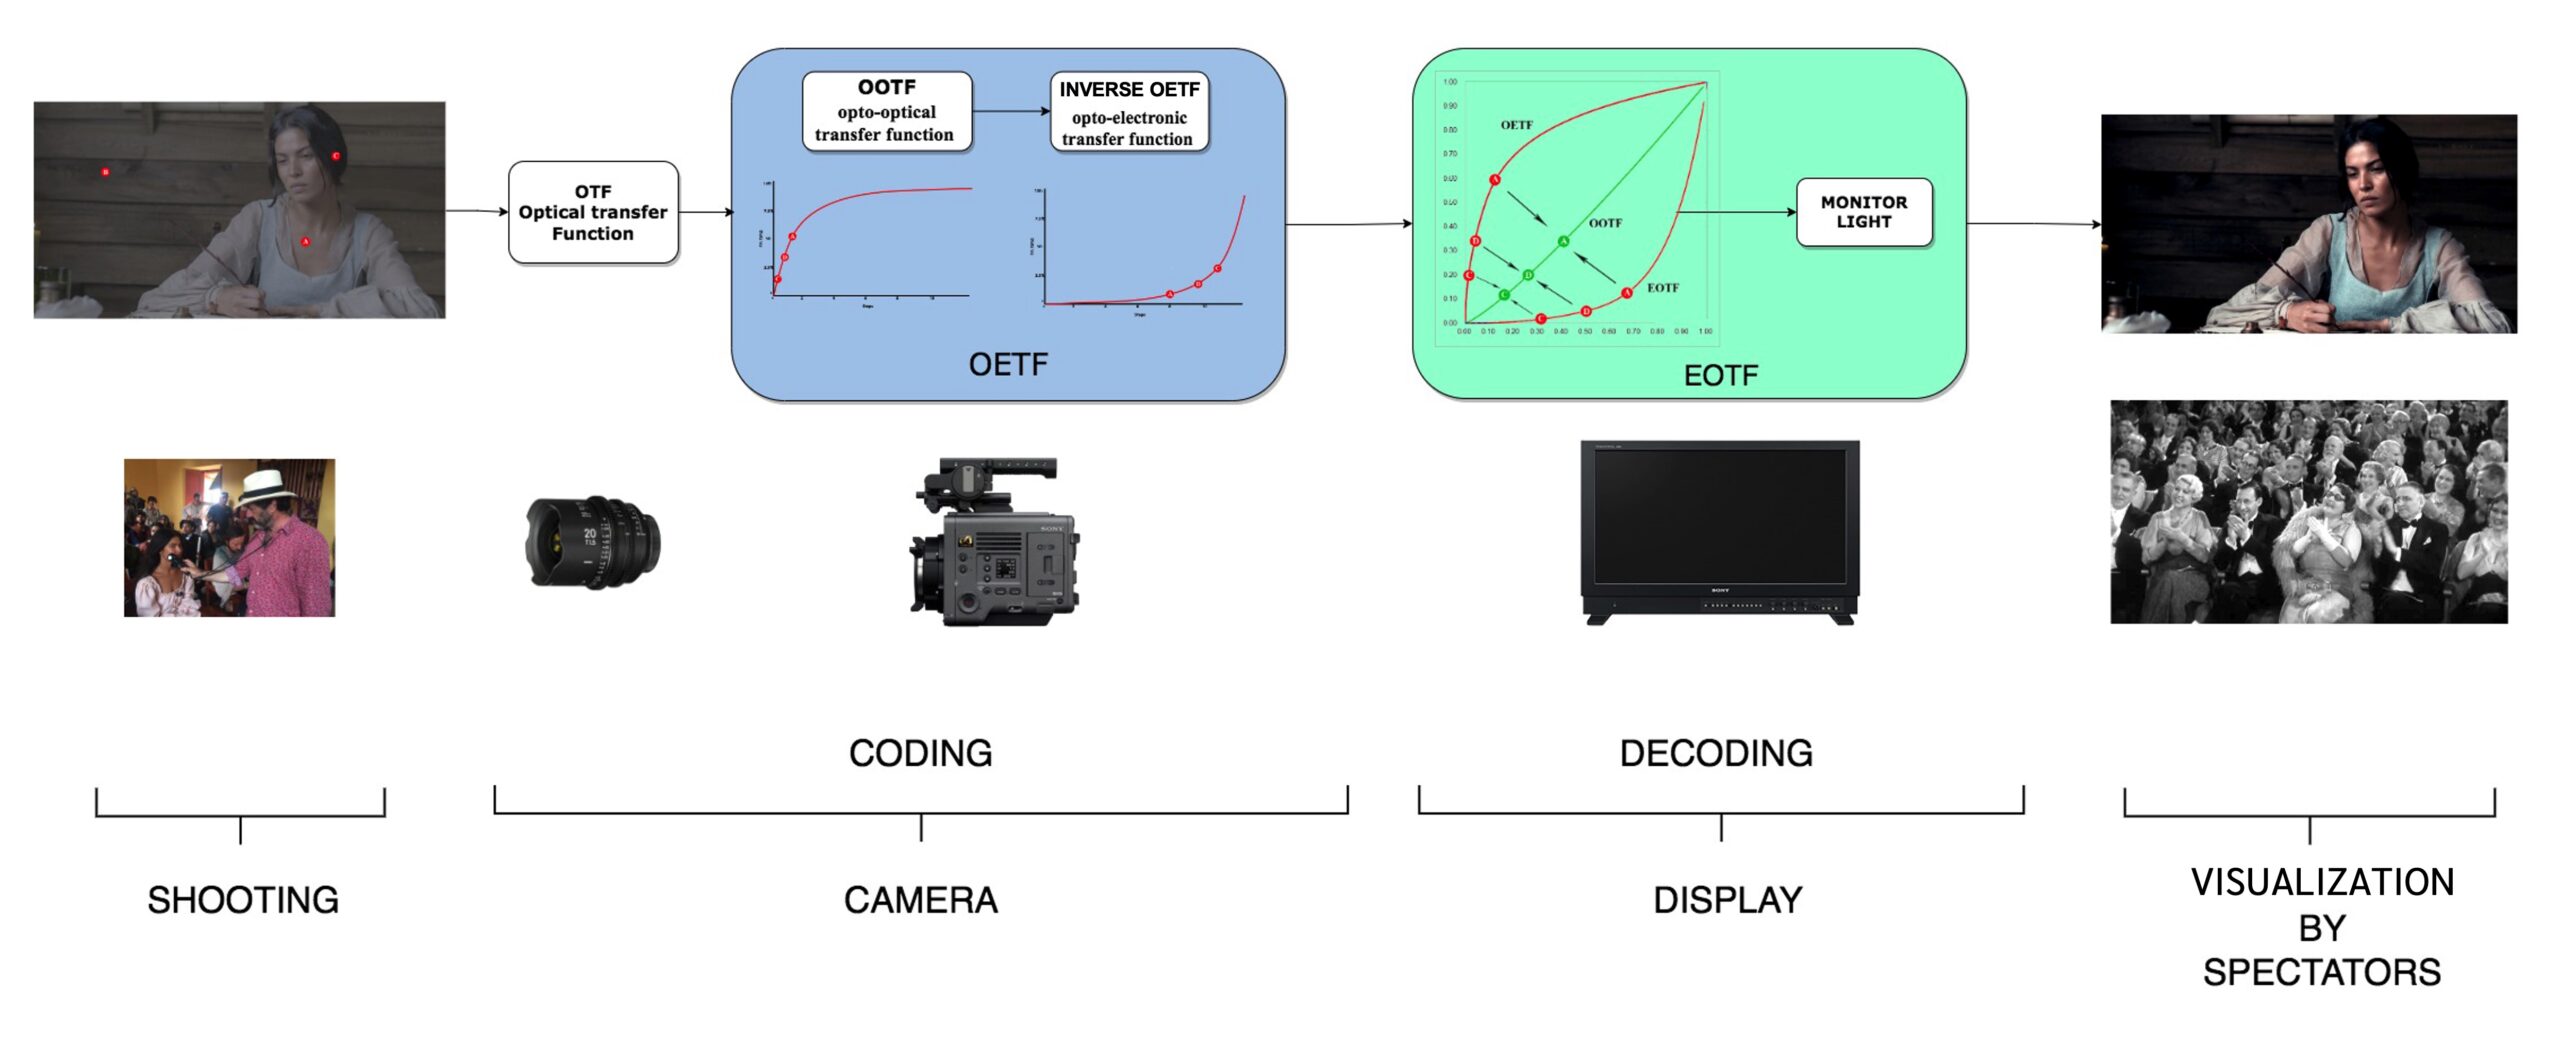
Figure 4
In the diagram of figure 4 we show in a very simplified way the HDR system with the PQ curve according to the document ITU.F BT.2390-3. The process begins with lighting the scene and managing the contrast ranges that the director of photography establishes. The values that we use to express the contrast range can be F stop, or cd/m2 or lux (depending on the type of measurement we make, reflected or incident) and we can, as we will see later, also do it in the zone nomenclature or in the colors of the false color. The lens is the first tool that light coming from the scene passes through; it projects an image circle onto the sensor. This first transformation is known as OTF (Optical transfer function). Follows the camera that converts the light projected on the sensor into linear digital brightness values that through the OETF function (opto-electronic transfer function) makes a distribution of said values according to a determined gamma curve also conditioned by the settings of the OOTF function (opto-optical transfer function) which is a psychovisual function that compensates for the tonal difference that occurs between the camera area and the display area, guaranteeing perceptually constant images (something very important in HDR). To see the image, we must apply another function, EOTF (electro-optical transfer function) that converts that camera signal into the linear brightness output on the monitor.
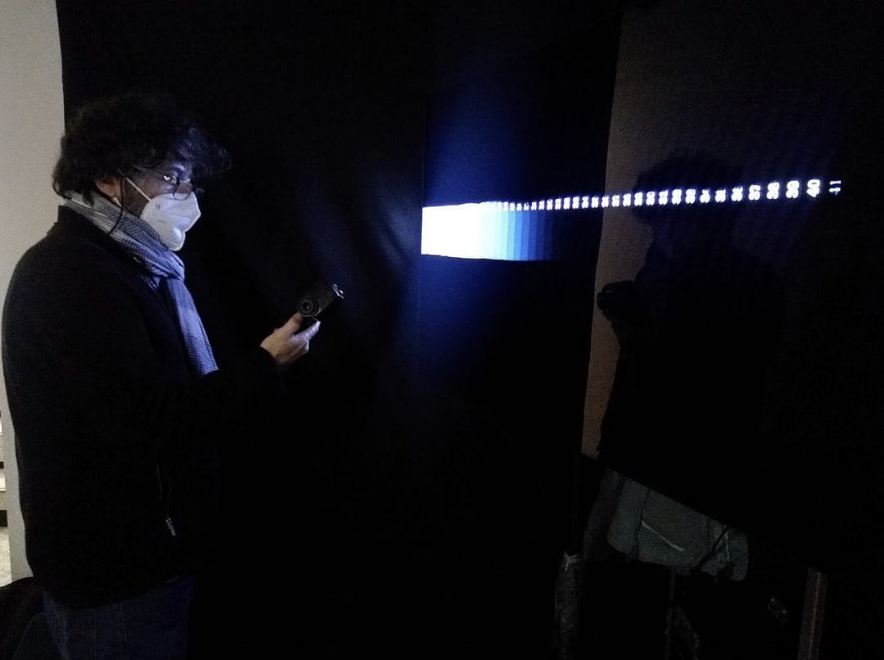
Alfonso Parra AEC, ADFC. Test at FilmFlow set
Let’s take a look at this test we’ve done together with FilmFlow. We have photographed a Stouffer strip, which is a wedge with 41 calibrated density values, and we have measured the values of each step-in cd/m2 using a spot meter (figure 5). We have visualized the original material with the S-Log3 curve and on it we have measured the cv values (figure 6), to then measure the nits of the monitor (Flanders DM240 and a TV logic HDR television) that generated that curve with the corresponding EOTF, of in this way we generated a table that related all the values.
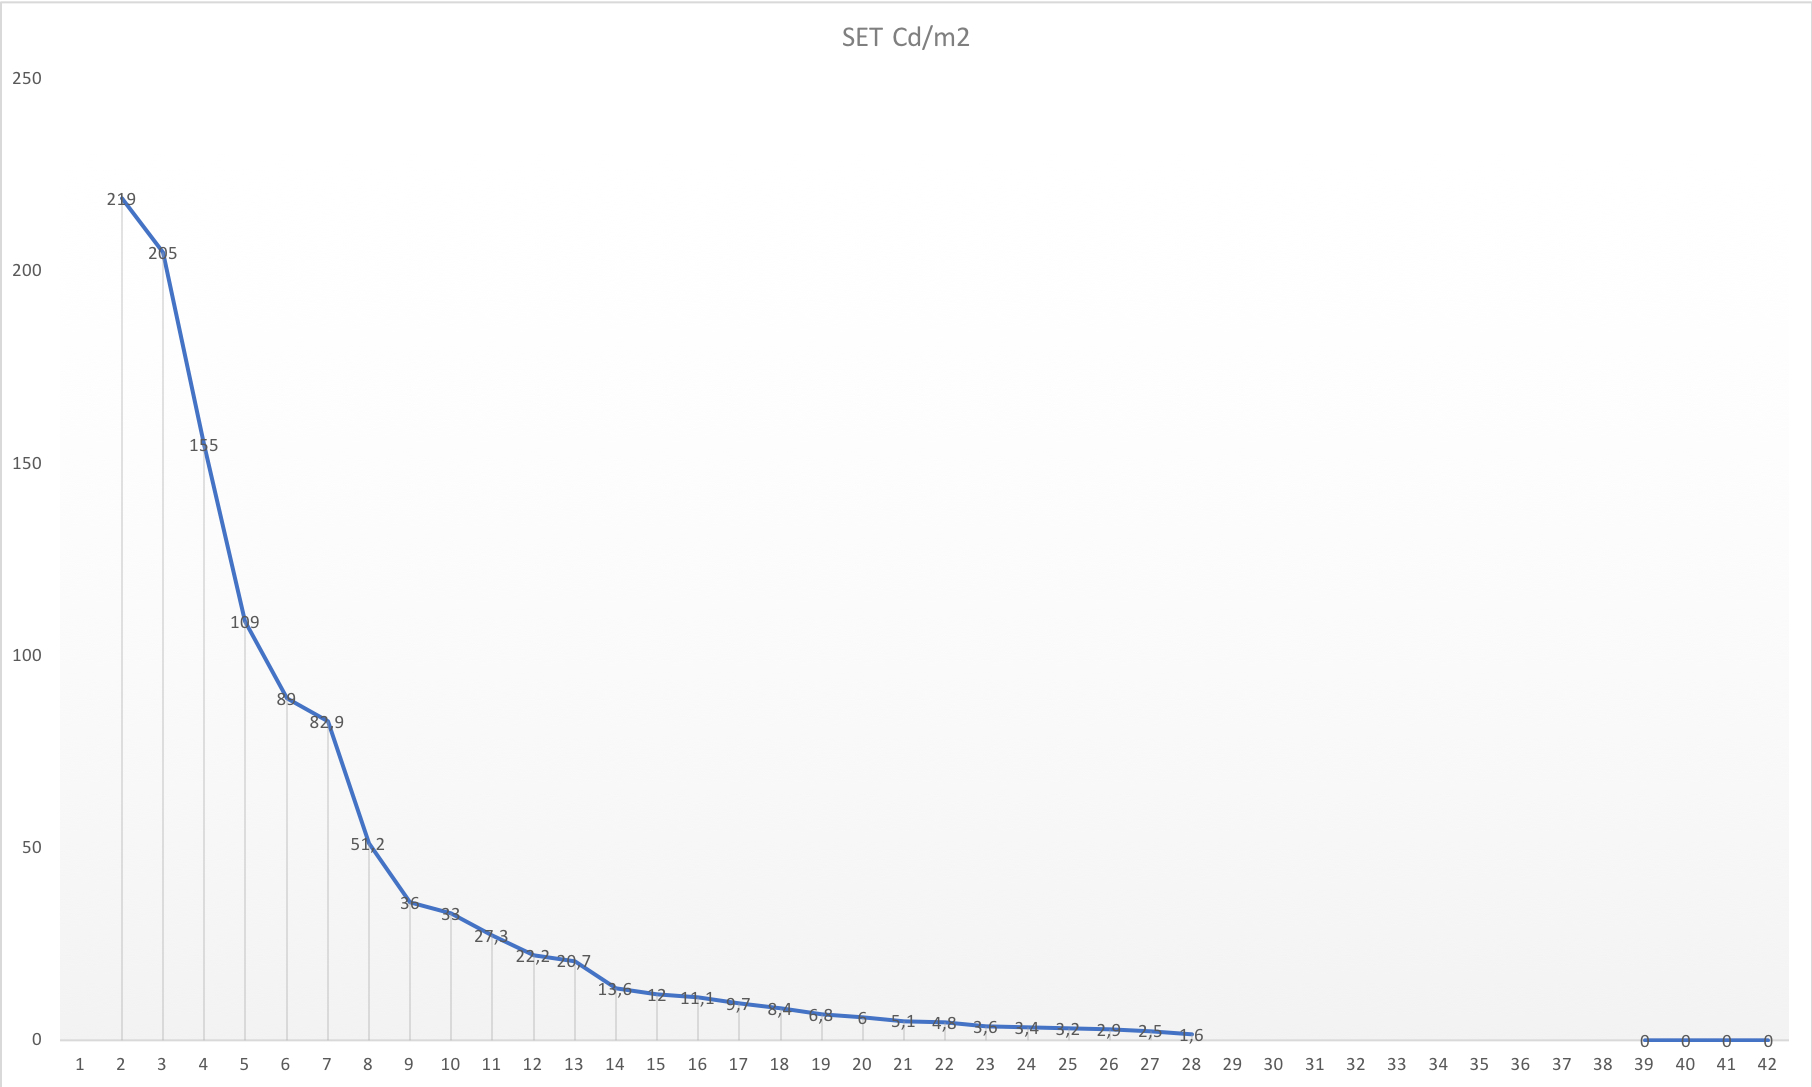
Figure 5
This graph represents the values in cd/m2 measured with the spotmeter of the steps of the stouffer wedge.
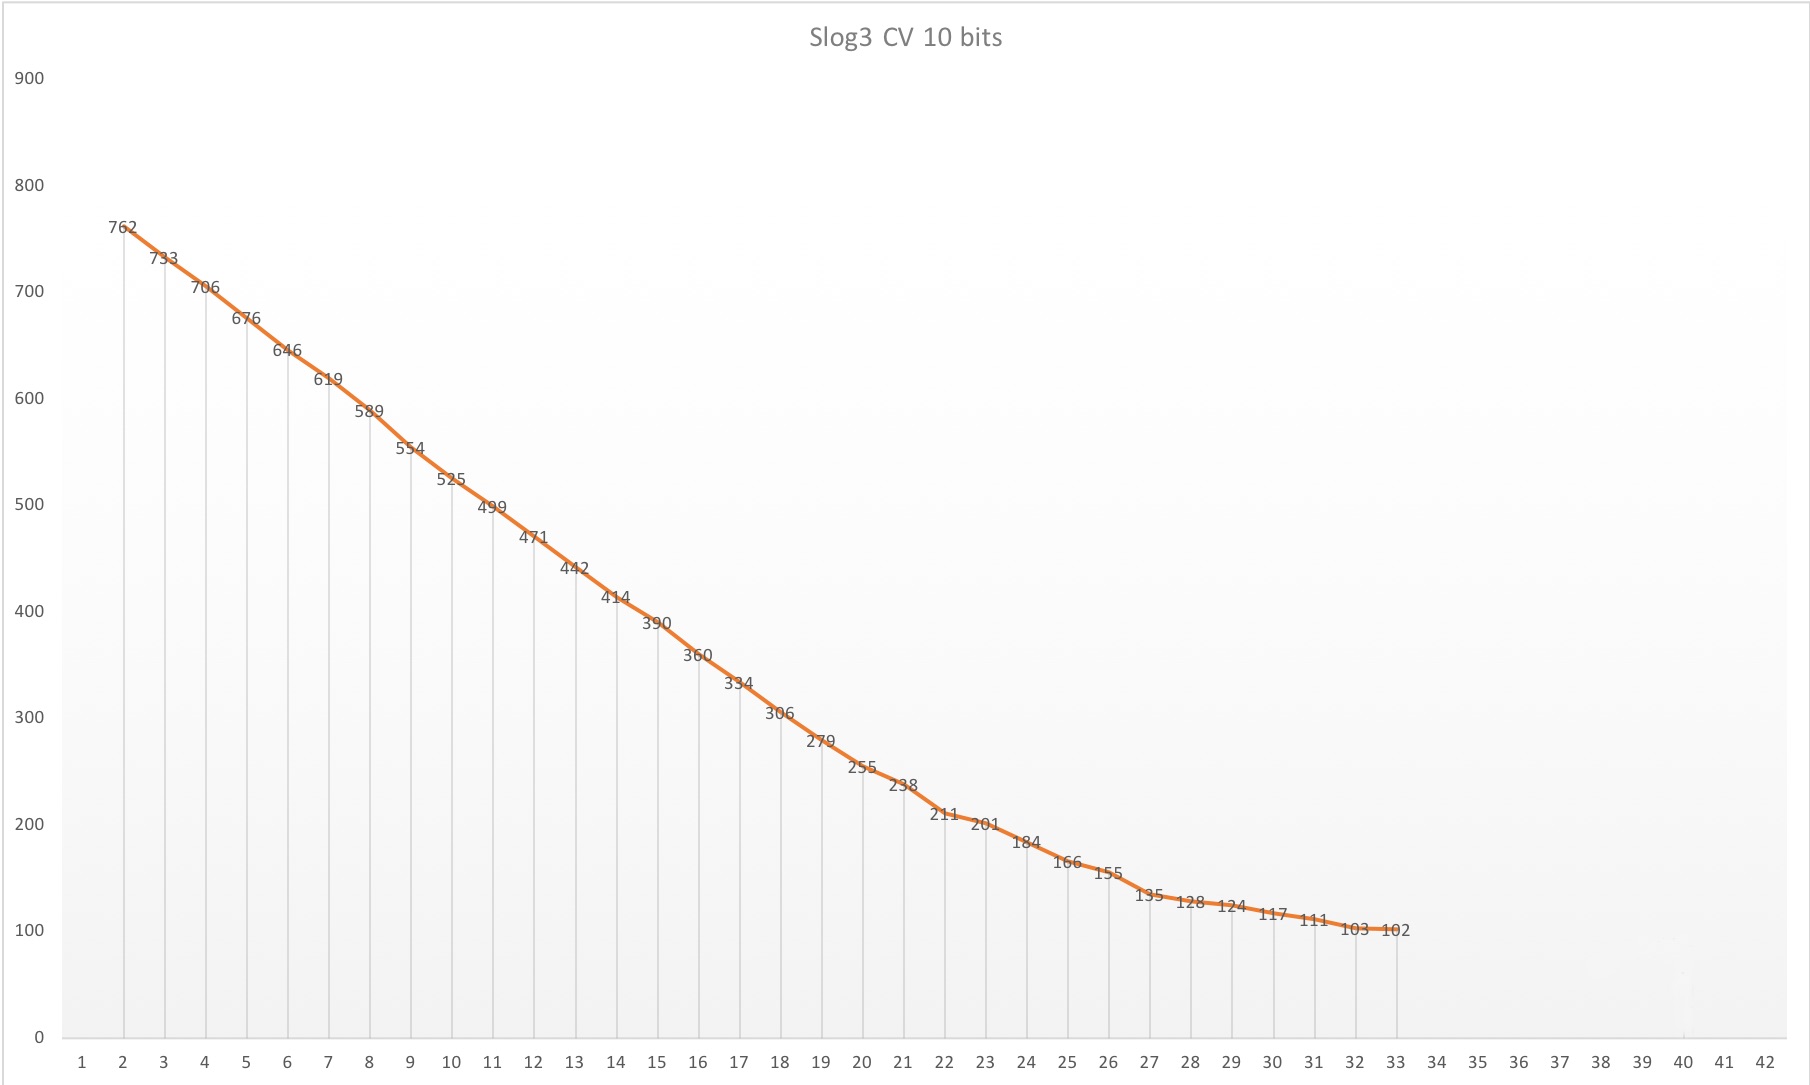
Figure 6
Figure 6 shows the cv measured from the image of the wedge with the Slog3 curve, in such a way that the cd/m2 values become those code values with that gamma curve on an Aces space, here we put that comparison for greater clarity (figure 7).
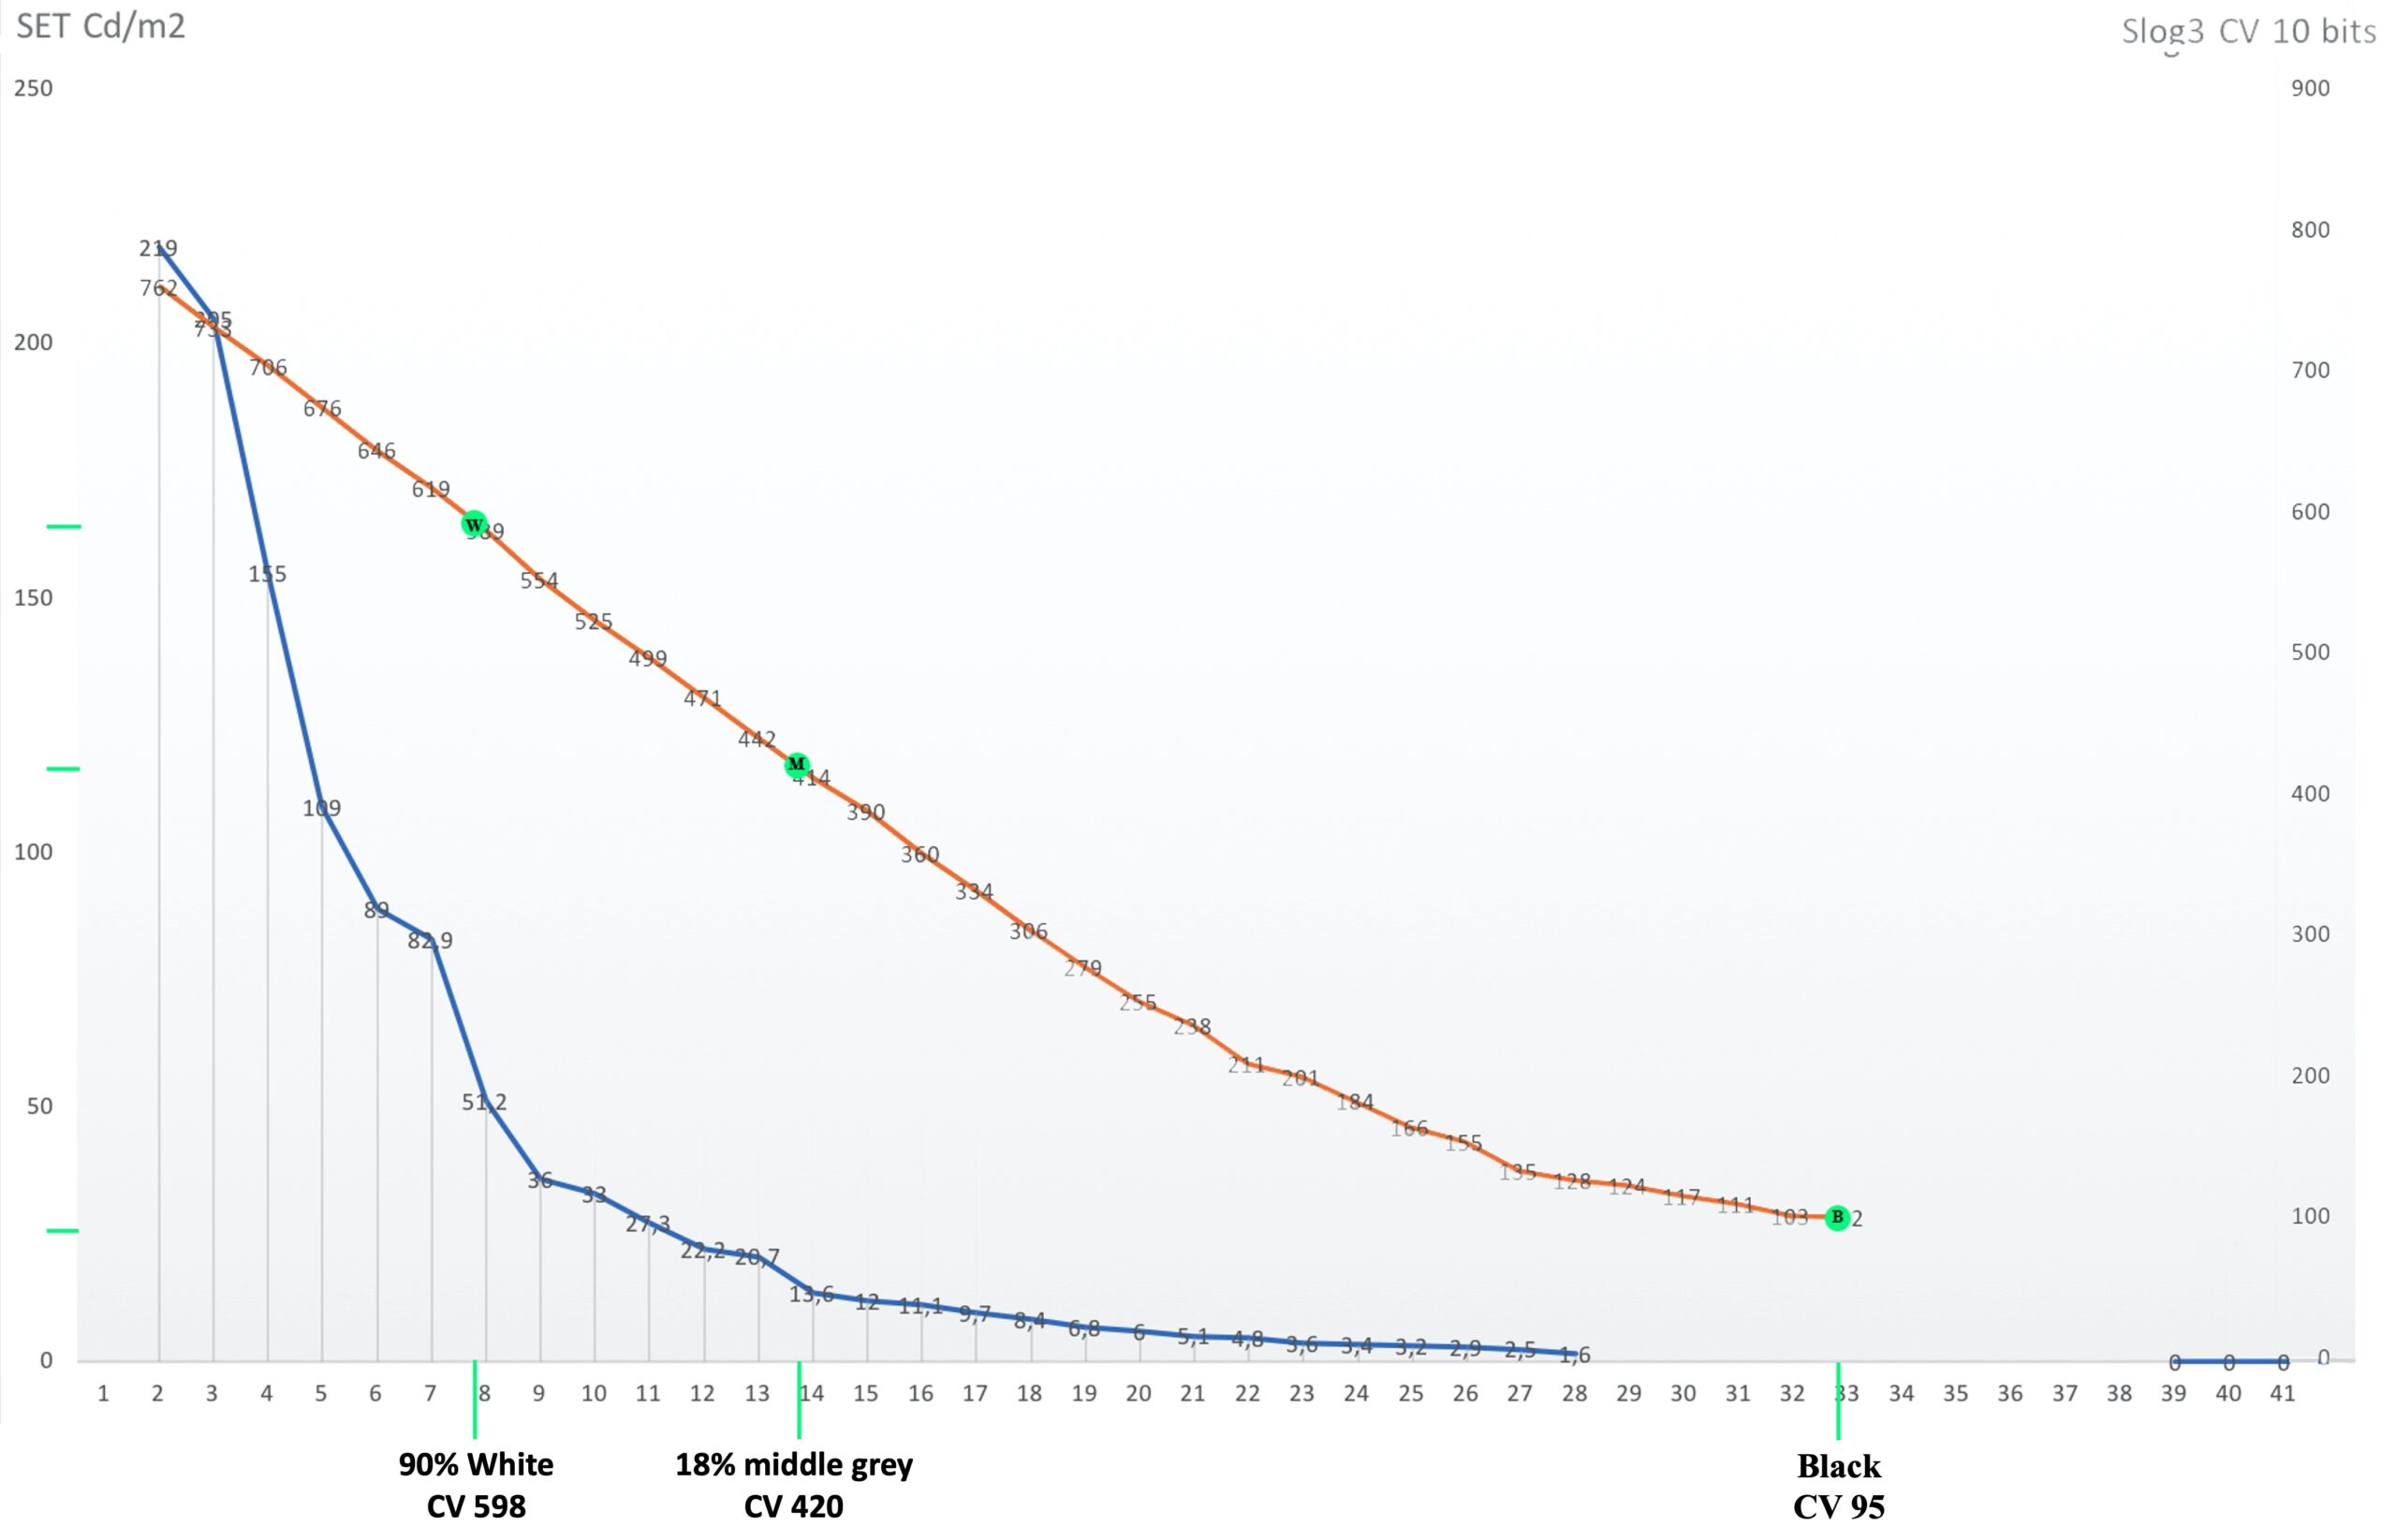
Figure 7
Once the digital file with these values has been created, we proceed to see how these values are transformed back into nits (cd/m2) in the display systems (figure 8).
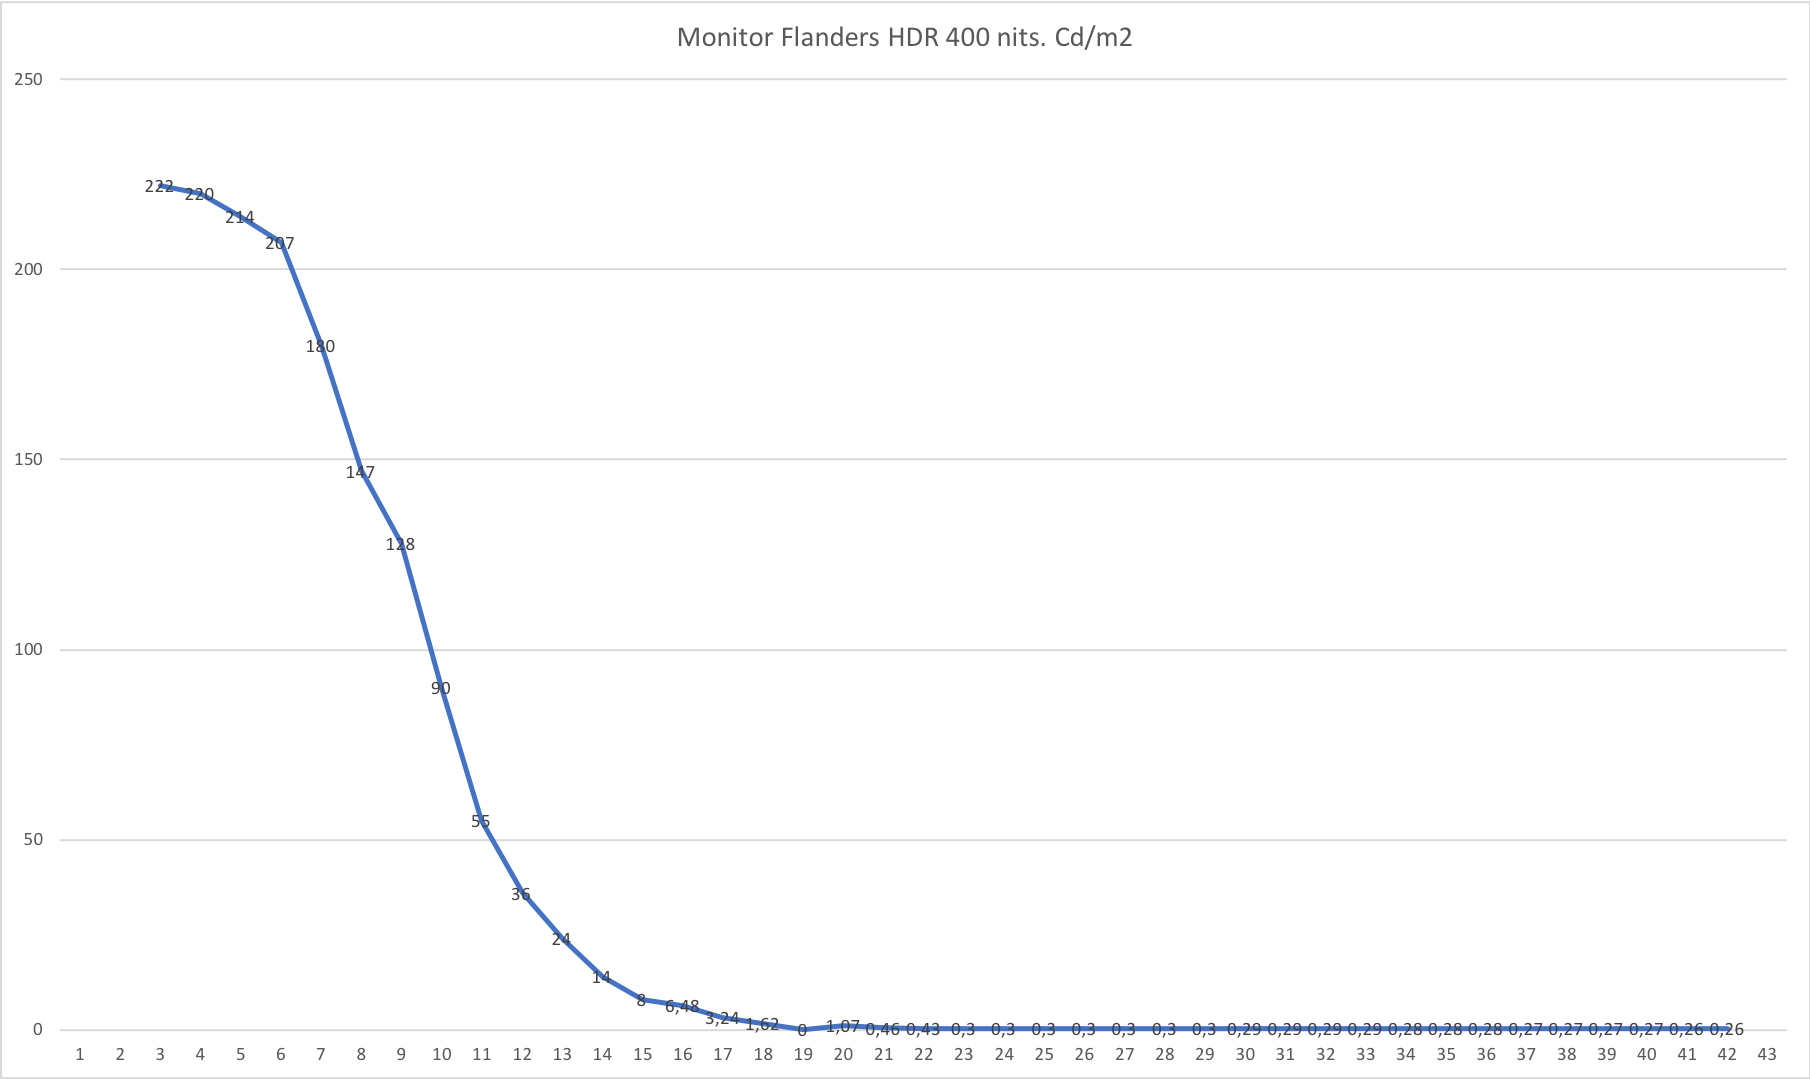
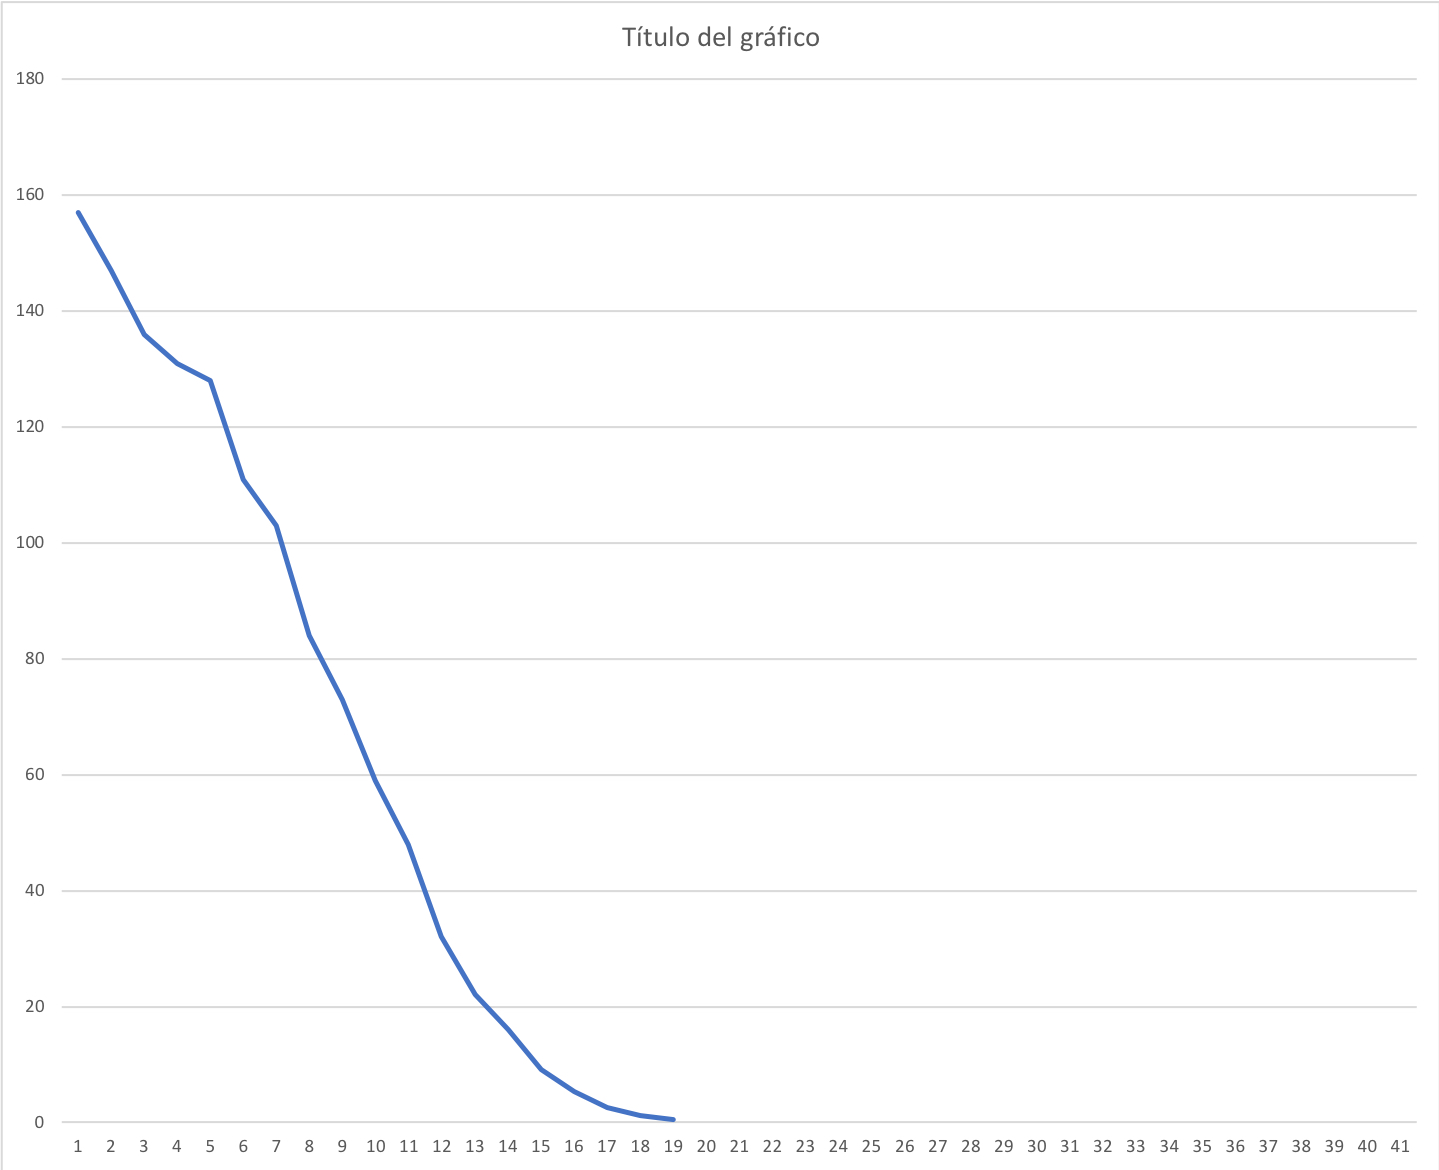
Monitor Flanders Nits measures from Souffer wedge. TV HDR TV Logic. Nits measures from Souffer wedge.
Figure 8
We can observe the differences in values that occur from the same wedge between the monitor and the television. In figure 9 the three curves are superimposed: the measurement of the scene, its conversion into digital values and the brightness values on the monitor and how they change, in yellow the changes from the measured cd/m2 to the cv and from these (in blue) to the nits of the monitor, taking as reference three values, white, medium gray and black.
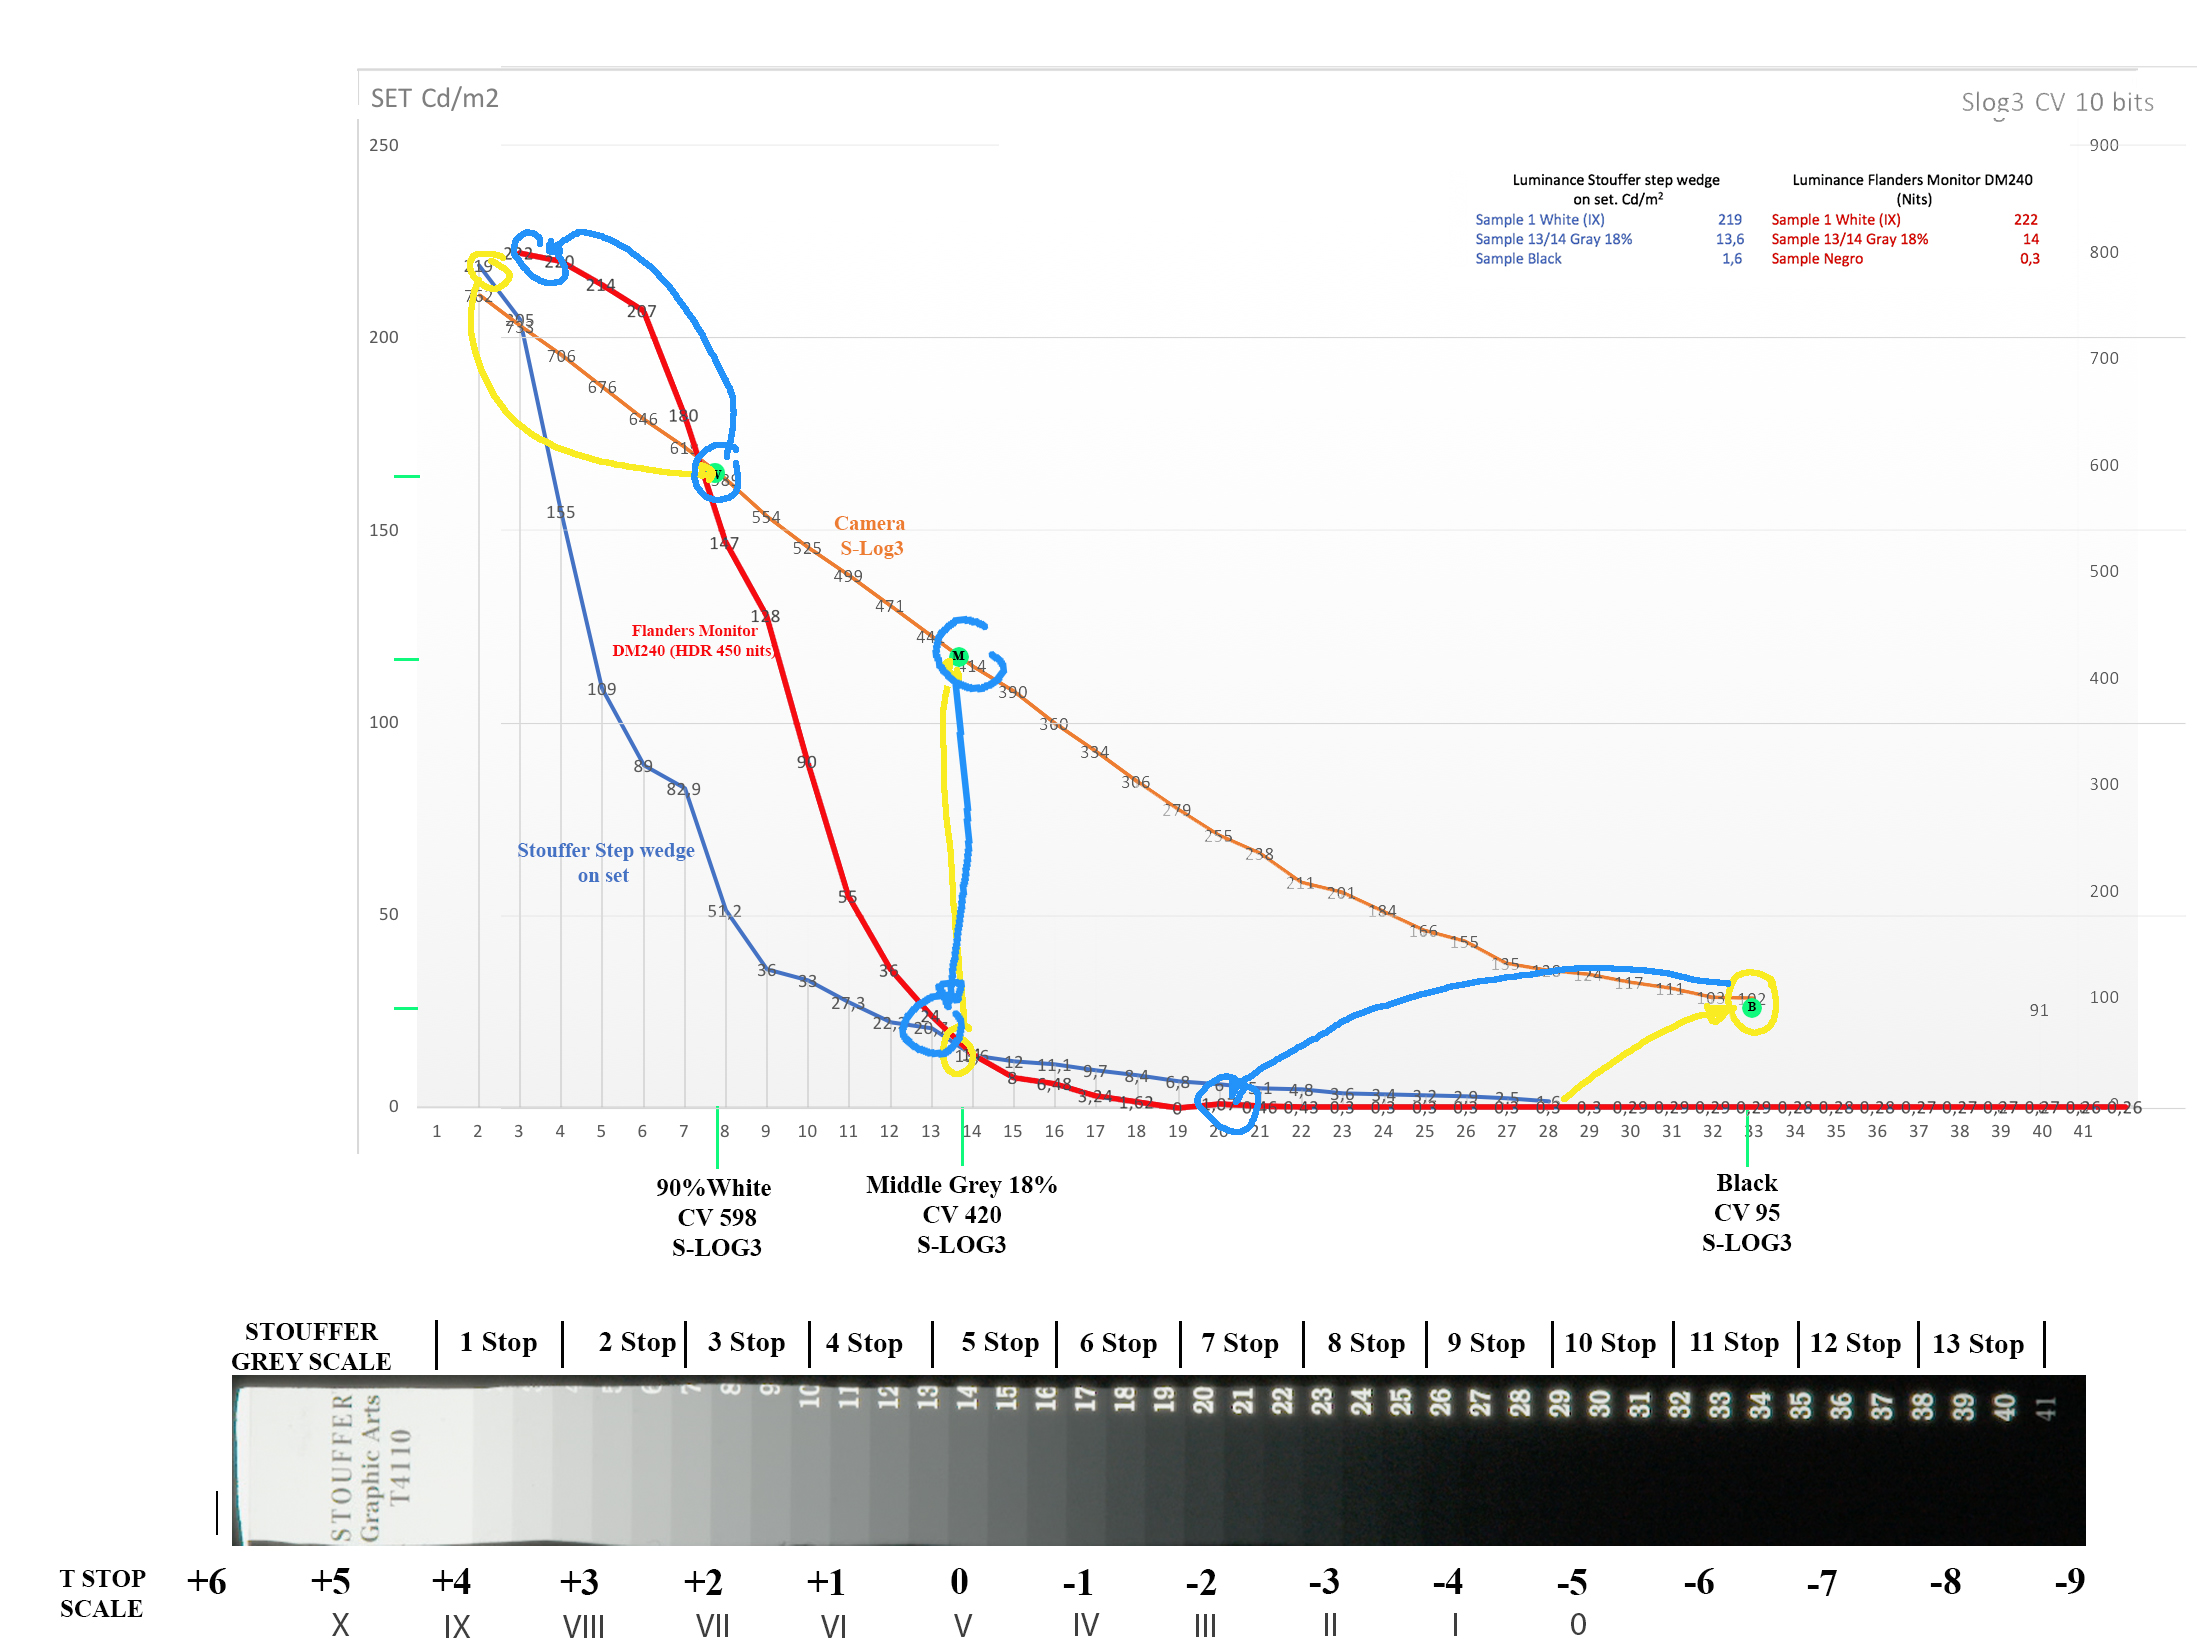
Figure 9
We note that the mid-gray value roughly matches the wedge’s measured luminance in real space and the nits measured on the Flanders monitor, let’s say zone V corresponds to the same luminance value in both cases.
Towards the highlights, the luminance values no longer correspond until zone IX, which are similar, however, in the values that go from zone VI to zone VIII, the luminance values change considerably, for example sample 10 within zone VI in the measurement of the real wedge it has a value of 33 cd/m2 while in the monitor the sample corresponds to a value of 90 nits. If we consider the zones from the measurement of the real wedge, then the value of the measurement on the monitor would fall in zone VIII, establishing similar luminance values between both areas. If we consider the zones from the perspective of the monitor, then zone VI of the monitor would be equivalent in luminance to zone VIII of the real slot. Between the luminance values of both areas towards the highlights there is a difference of two zones, one being zone VI and the other being zone VIII. We try to find out what correlation in luminance values there is between real space and its representation on a monitor, going through a determined process and as transparent as possible.
In the shadows there are also changes in the luminance relationships of both fields. For example, sample 26 in zone I of the real wedge shows a value of 2.9 cd/m2 while the monitor is 0.3 nits, practically from zone 0 to zone III of the real wedge it remains very dark in the monitor.
Thus, the Flanders monitor presents a higher contrast, with darker blacks and less detail and brighter whites than the wedge. We have done this same exercise with the TV logic HDR with different results as expected. Although with this exercise I can know what the luminance and detail displayed on a given monitor will be like, with a given gamma curve and without colorization processes of the scene I photograph, that is, what the contrast ratio of the scene will be like and your display. The question is, can a pattern be established that responds to the traditional zone system that allows us to predict the result of an image on a given monitor? In my opinion and after all these exercises the answer is no. And furthermore, what is the interest of working in this way, or what advantages does it offer? If we take one more step, we will see that the reality when working with our digital images is much more complex and the variables multiply.
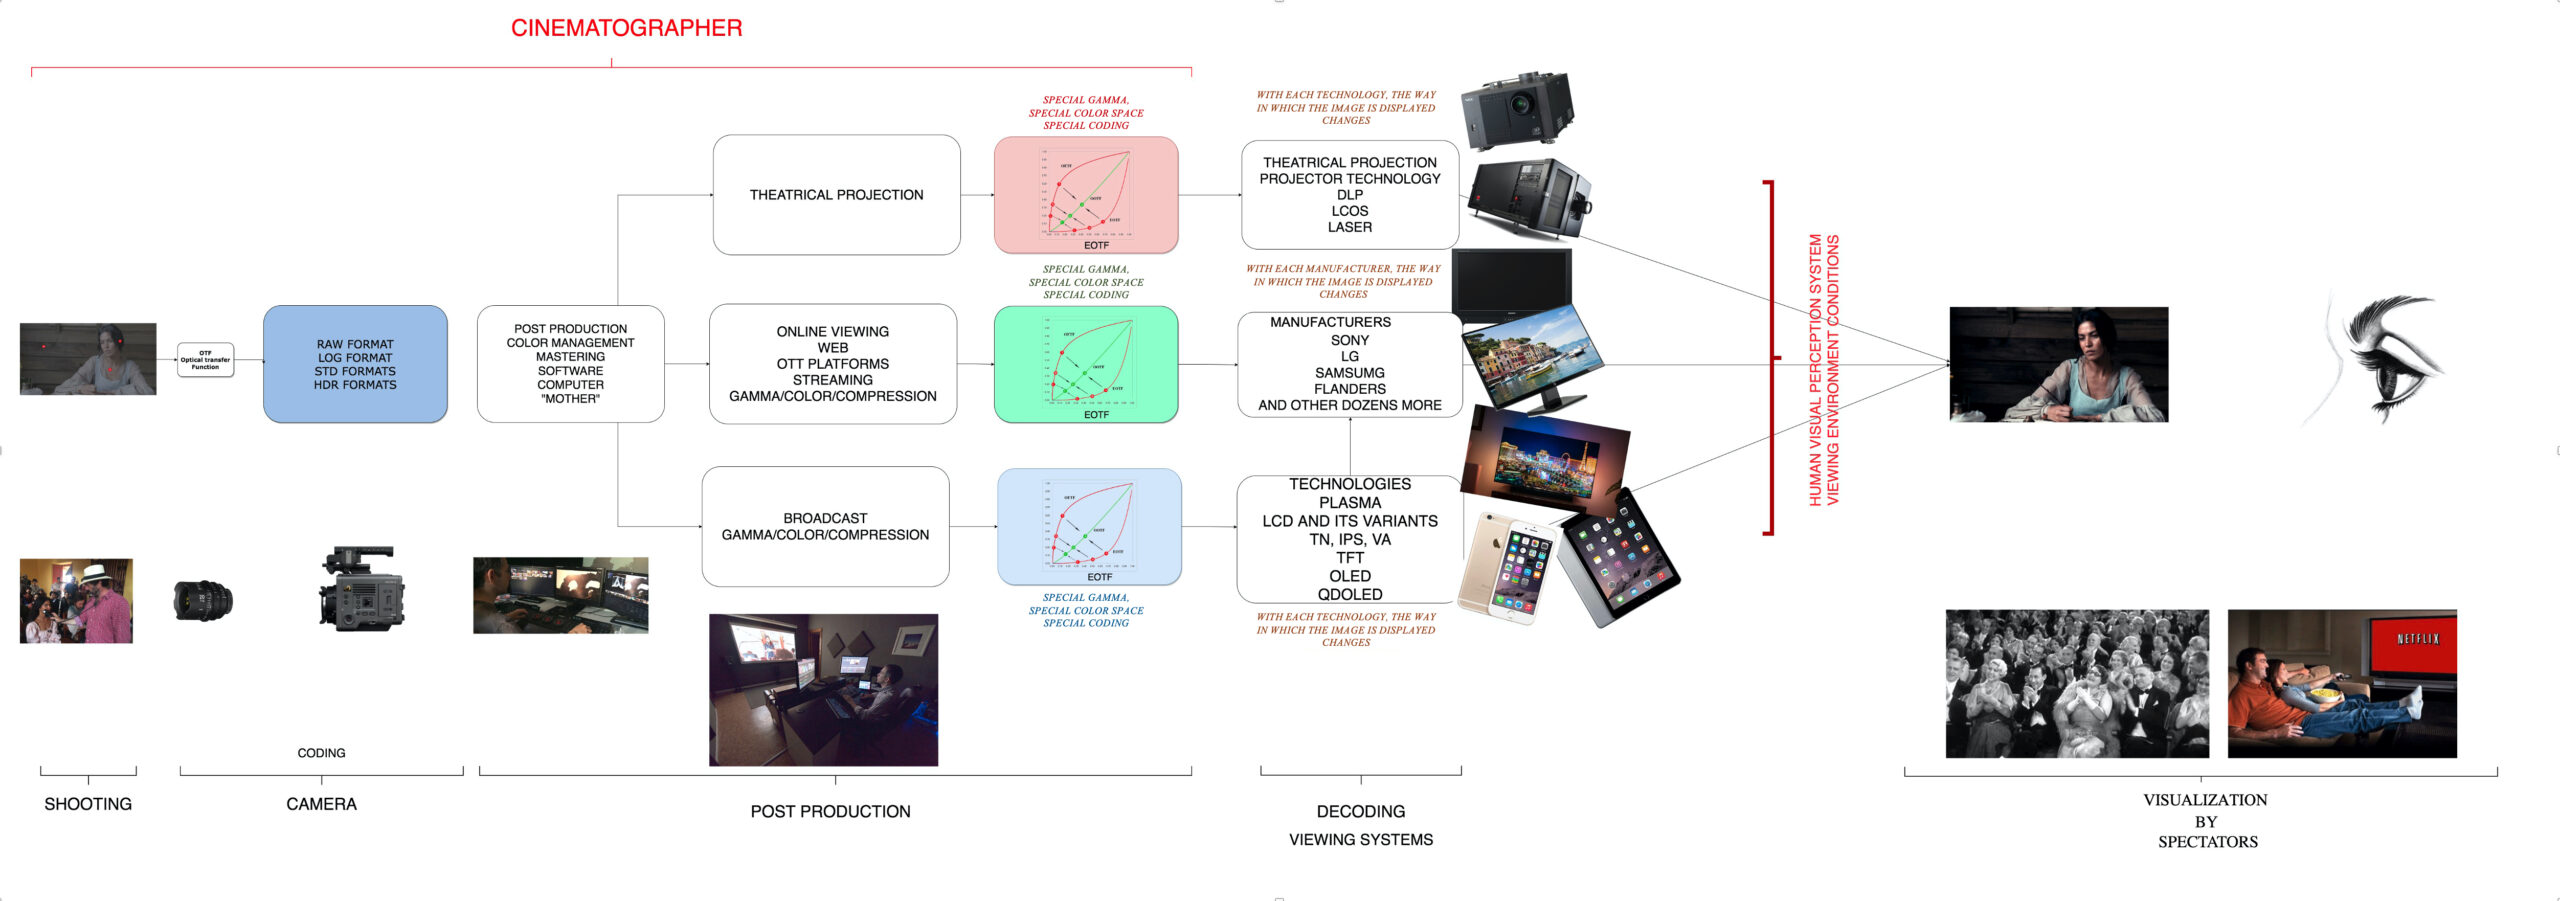
Figure 10
The values that we measure in the scene and that we finally see on the screen or any other means of visualization, is determined by everything that the diagram shows. First the camera, with its different gamma curves, (something like if in analog we change the emulsion or development processes) transfer functions, etc., its different encoding files with or without compression, then the transformation that the color management system to work on the image in its many facets: color, resolution, exposure, noise or geometry in addition to the different processes for the final visualization, if it is for cinematographic projection, if it is for OTTS, web or broadcast and there is also To add that monitors, projectors, tablets or phones have different technologies and therefore our image looks different in each of them, even when two manufacturers use the same technology differences appear. Without forgetting our own vision and the environment in which we observe the image (figure 10). All this affects our system of zones, for example, the “plasticity” of the digital format allows us to modify the zones in colorization, in such a way that zone V of the scene shot can end up being zone III or that zone X can end up being zone VII. The parameters are so many and so complex that maintaining a consistency of the zones throughout the entire flow is practically impossible, but is it also necessary? As directors of photography, we can control (although not always) the processes that go from shooting to mastering, but beyond that the terrain is unknown, despite repeated attempts over and over again to establish mechanisms that allow the viewer to see the images as we conceived and created them.
If we remember the main objective of the zone system exposed at the beginning of the article, which is to anticipate the contrast of my final positive copy, what need do we have to do that when in the digital world we are immediately seeing that transcription on a monitor or a screen or its representation in a wfm? In reality, in the digital world we do not need to foresee how the image will look, although we do need to know all the processes involved in order to have control of the photograph throughout the process of creation, manipulation and exhibition. The complexity of the variables that intervene in the creation of the digital image, as well as the immediacy and plasticity of the system, makes it unnecessary, in my opinion, to work with a zone system understood as it was created by the analog world back in the late 1930s of the last century.
So many twists and turns and so much graphics to reach such a conclusion, yes, but… there is something that we can rescue from that system and it is the conceptual framework of evaluating the exposure considering areas of the image, in their luminance relationship and therefore of the detail that they can show, in one way or another after the processes to which we submit the image; because it must be said, despite what has been shown above, that the digital cinematographic world is not the Wild West either, where there is no law, on the contrary, there are many “laws”, in fact there are standards, norms and descriptions of the processes subject to organizations international, although the standards are interpreted and modified according to manufacturers and technologies.
When calculating our exposure, we take into account the contrast ratios of the scene, among many other variables, and with this we determine the atmosphere it presents, how the camera captures it and how the monitor represents it. With analog technology we can measure different areas of the scene by means of a spot meter, comparing their values and thus establishing the different relationships not only in luminance but also in the detail that each area reveals, all adjusted to the sensitometric curve of each emulsion (both negative and positive). The measure that directors of photography have normally used to establish this relationship is the scale of the diaphragms (F values) although ev or cd/m2 values can also be used. We can do something similar in the digital world, which is to measure the different luminance values of the scene in relation to the gamma curve and its dynamic range. With the arrival of digital cinematography, video signals and histograms appear in our world. The image captured by the camera is shown in the form of a signal that is measured in mv (millivolt) or ire values, something that is alien to cinematography and with digital photography cameras the histogram arrived, some even further from our form to measure However, we have become accustomed to handling waveform monitors, vectorscopes and histograms without even getting manufacturers to introduce F stop scales in their devices. That is why I want to review here the False Color system adapted to F numbers designed by Ed Lachman and Barry Russo. This system is represented in the same way as a traditional false color except that its measurement values are not IRE values but F stop and it allows to represent about 15 zones compared to the 6 or 7 that the usual false color uses, which makes it much more precise to when evaluating the exposure and contrast range of the scene. When applying it, our image appears with a series of colors and each one of them corresponds to a certain F stop in relation to the gray 18% reference value in the world of cinematography(2) (figure 11)

Figure 11
This way of evaluating exposure directly from the camera (a true spot meter) is currently implemented in Panasonic cameras and waiting for other manufacturers to adopt it. We have to consider that these values/colors are closely related to the gamma curves that are applied and therefore to the dynamic range that is allowed. With the variation of the gamma curves, the values (cv) vary, although not the absolute relationship between the different tones that always represent the same difference in value.
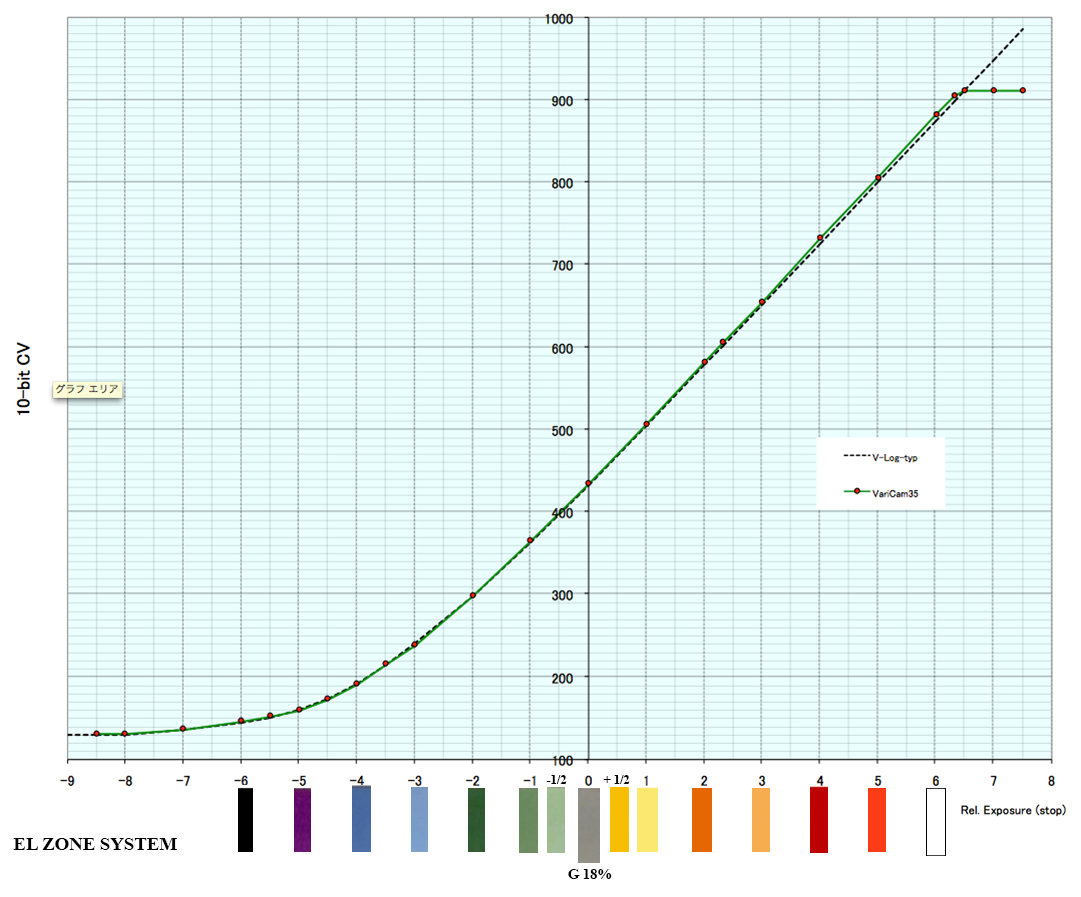
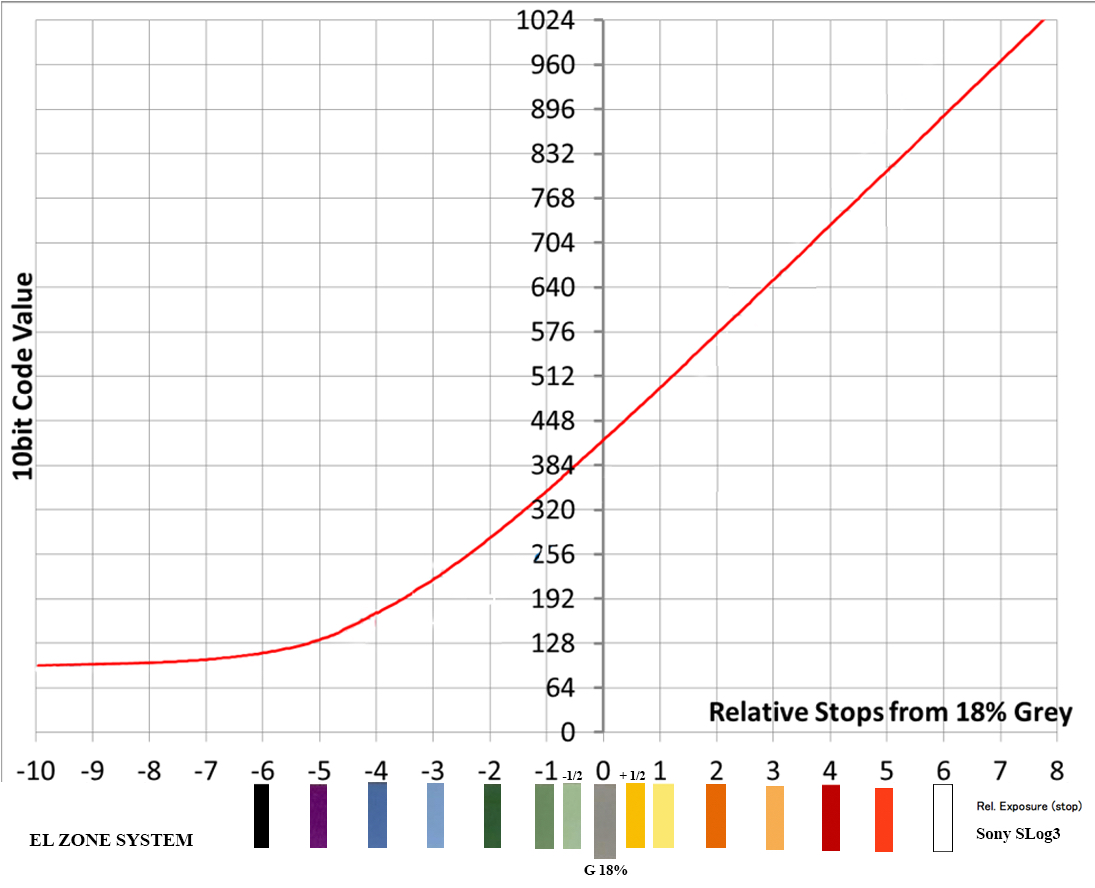
Figure 12
Figure 12 shows the code difference (cv) between the Panasonic Varicam curve (left) and the Sony Slog3 curve (right). On the horizontal axis the f stop and the vertical axis the cv in 10 bits. Each gamma curve of each manufacturer will thus show slight differences in brightness on the monitors or, what is the same, a variation in the zones. Zone V is different for Canon than it is for Sony, Red, Arri or Panasonic and within each manufacturer it is also different for the different gamma curves they handle (figure 13)
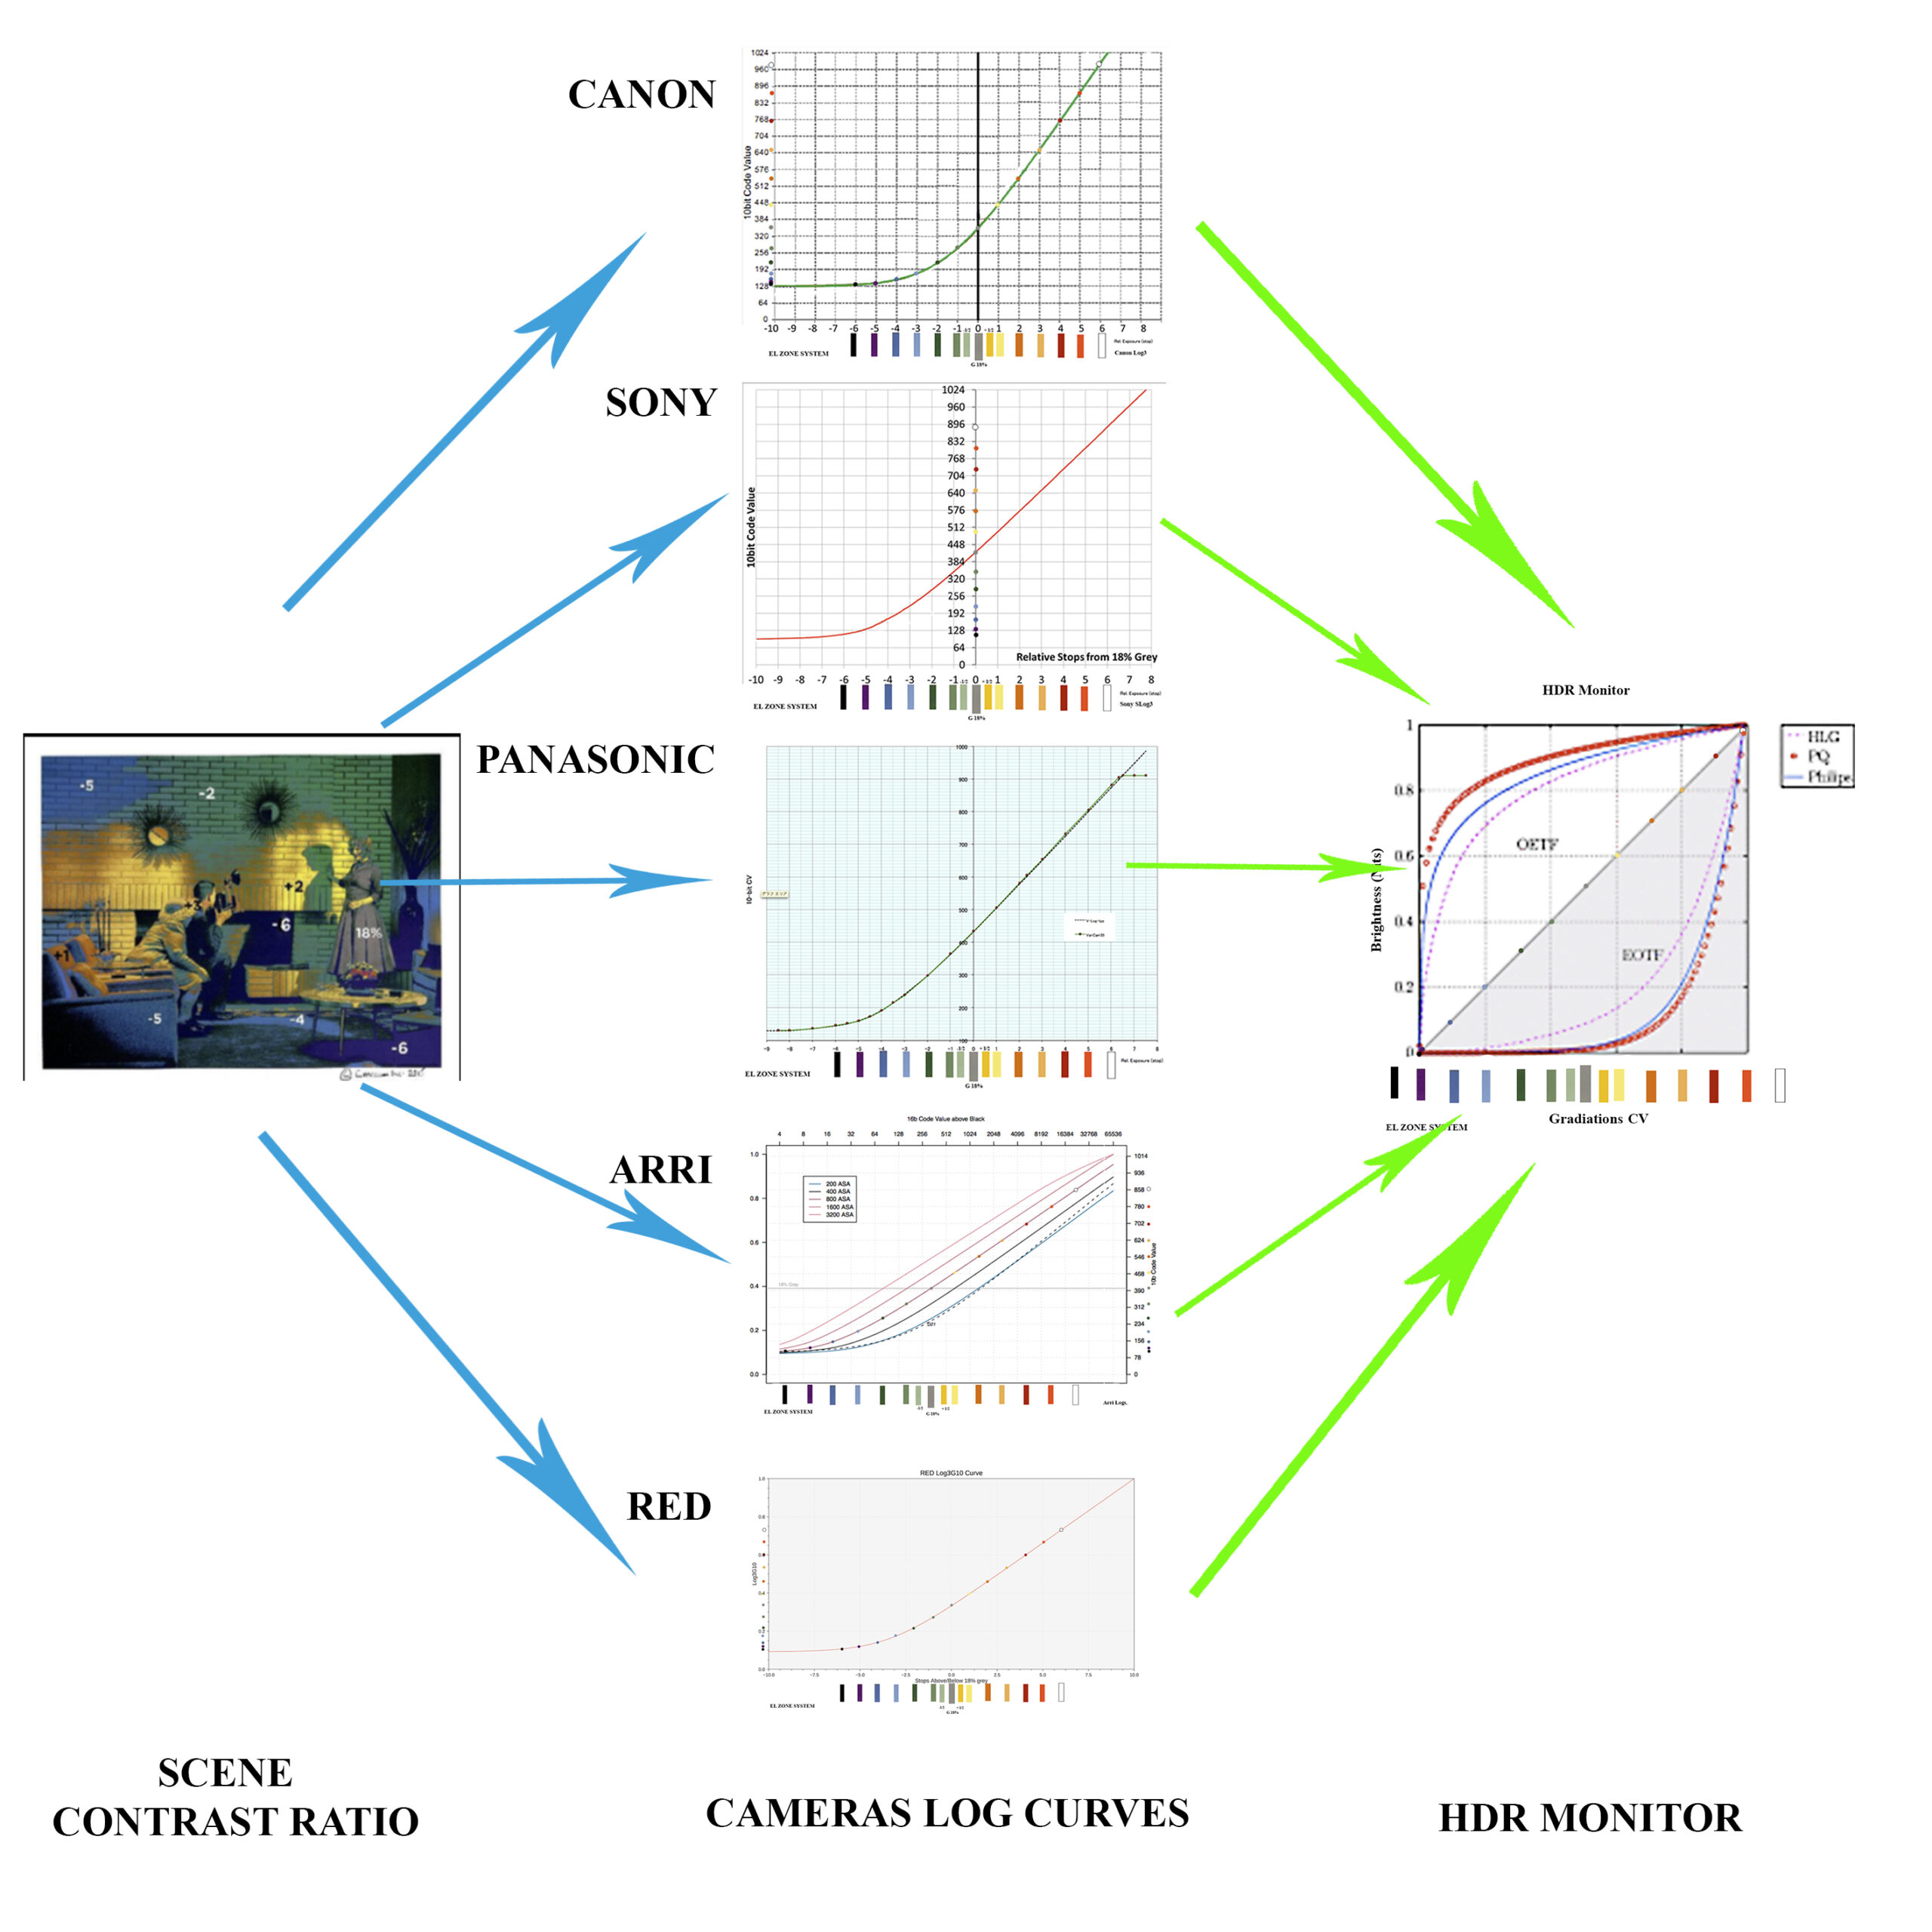
Figure 13
Once again, the traditional system of zones remains in between, given the diversity of variables that intervene in the creation of the digital image. Note that the EL system is not so much a system as a way of visualizing the contrast ratio of the scene, through the use of a sophisticated False Color and that uses the F stops as a measurement reference, it is therefore a tool for expose, in the same sense that a wfm or a histogram can. The EL exposure evaluation system fulfills an aspiration of cinematographers to be able to measure in the digital world as we have done in the analog world, with the same concept.
In summary, I could point out that the rigidity of the traditional system of zones does not go well with the immediacy, versatility and diversity of digital environments and that it does not have an effective and necessary application in the world of digital cinematography, although its conceptual framework continues to have validity when exposing and thinking about the image as a whole where the processes of lighting, image capture, processing and finally projection are combined by dividing the scene into zones.
(1) The Practical Zone System for film and digital Photography. Chris Johnson. Focal press. Own translation
(2) EL system images courtesy of Ed Lachman and Barry Russo
References:
-The Practical Zone System for film and digital Photography. Chris Johnson. Focal press
-Report ITU-R Bt.2390-3 (10/2017)
-Handbook of Signal Processing Systems
Shuvra S. Bhattacharyya, Ed F. Deprettere, Rainer Leupers, Jarmo Takala
Springer, 13/10/2018
– Sistema de zonas en fotografía digital. Francisco Bernal Rosso
– El sistema de zonas. Control del tono fotográfico. Manolo Laguillo. Photovision
Acknowledgment: Adriana Bernal, Juan Pablo Bonilla, José Guardia, Jorge Igual, Philippe Ros and ITC members of IMAGO. My thanks to all of them for their time in reading the text and their timely comments on it.
In collaboration with:





Alfonso Parra © 2022


